PerturbScape
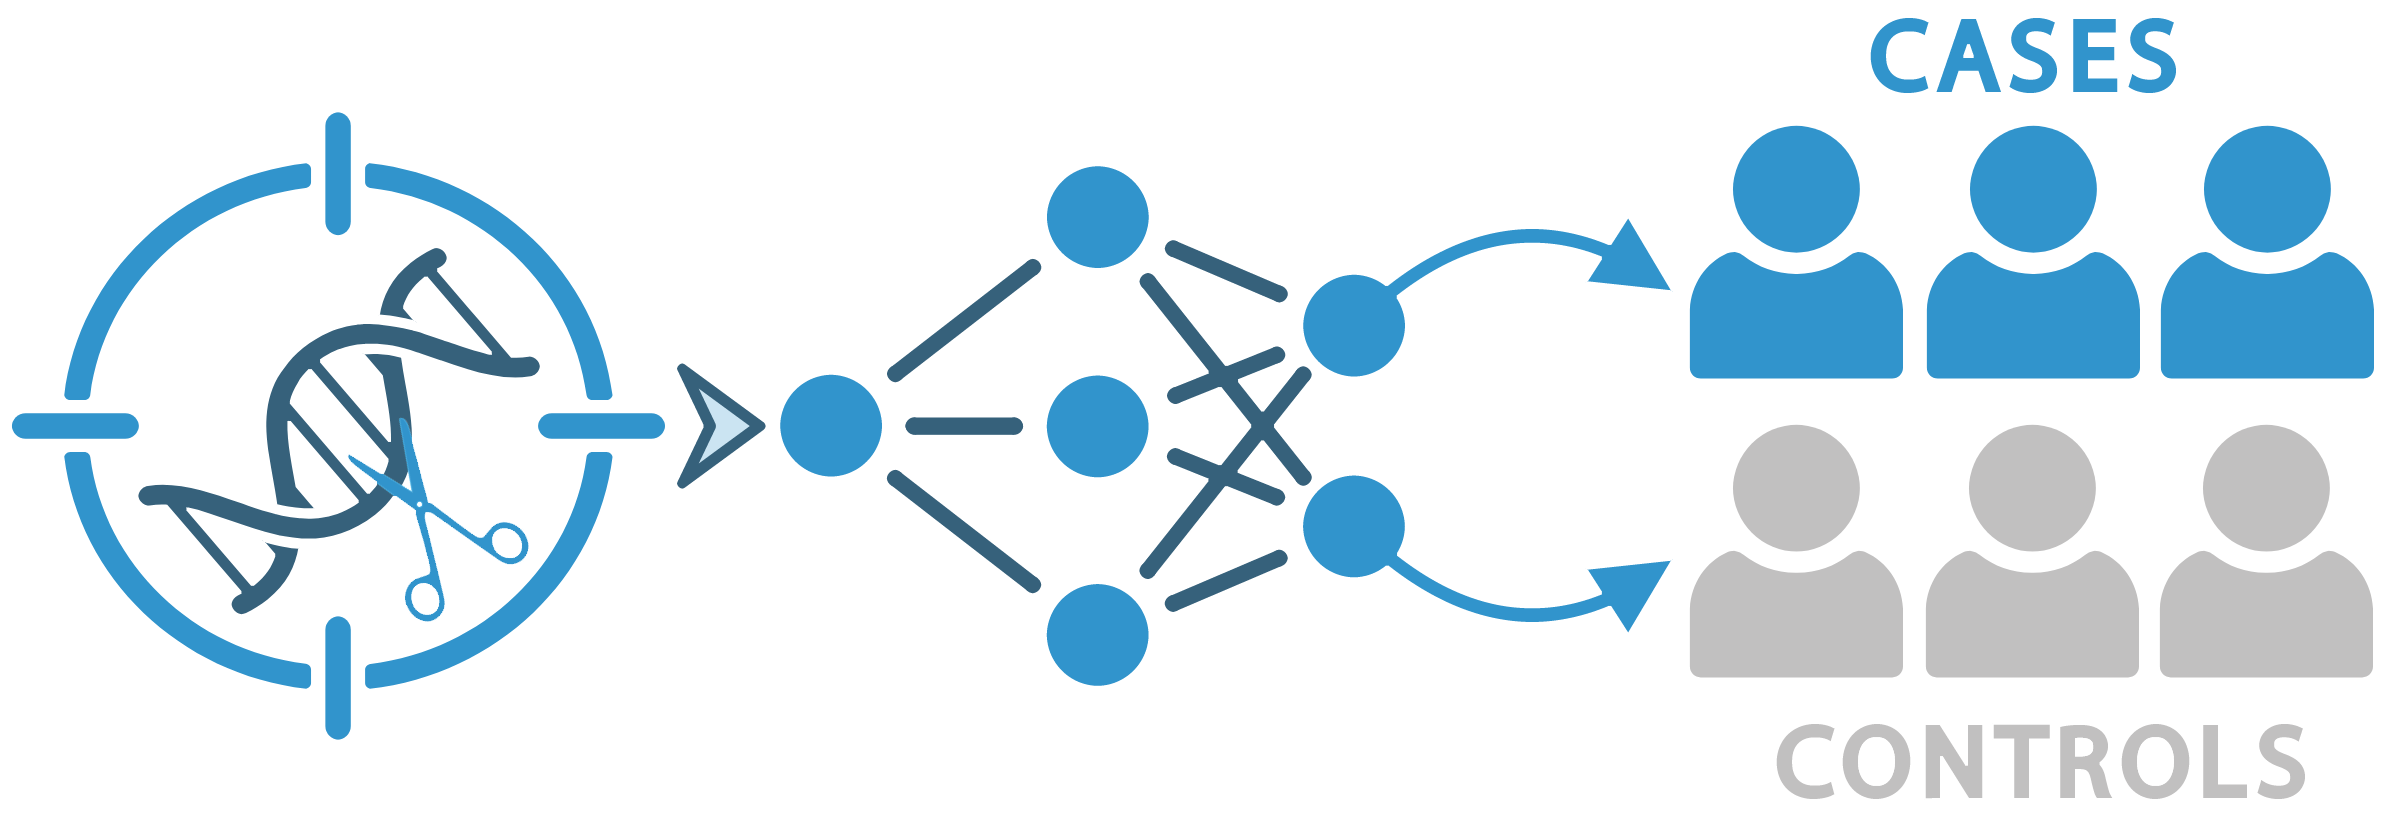
Perturbation to disease mapping
PerturbScape learns the gene programs that characterize distinct perturbation processes in Perturb-seq data, then measures how much of a complex disease's heritability those programs explain.
A Perturb-seq screen tells you what each perturbation does to a cell. It does not tell you whether that matters for disease. PerturbScape closes that gap in two stages: a Snakemake pipeline of eight complementary methods discovers gene programs, then a separate enrichment stage scores those programs against GWAS heritability to produce a Trait Relevance Score for every perturbation-trait pair.
Data Browser
Explore the results
Interactive UMAPs of 38,701 perturbation-trait pairs, coloured by TRS. Click any point for its meta-program genes and enriched pathways. Browse the data
Documentation
Run the pipeline
Installation, configuration, and the eight program modules, followed by the full disease-enrichment methodology with the code used at each step. Read the docs